Interactive star map recreates Project Hail Mary universe

💡See how massive open-source astronomical datasets are being repurposed for high-fidelity interactive visualization.
⚡ 30-Second TL;DR
What Changed
Utilizes ESA's GAIA DR3 dataset containing 1.8 billion stars
Why It Matters
This project highlights how open-source astronomical datasets can be leveraged for immersive storytelling and educational tools.
What To Do Next
Explore the GAIA DR3 dataset via the ESA archive API if you are building spatial or geospatial AI applications.
Key Points
- •Utilizes ESA's GAIA DR3 dataset containing 1.8 billion stars
- •Provides an interactive and accurate 3D spatial representation
- •Demonstrates advanced web-based astronomical data visualization
🧠 Deep Insight
Web-grounded analysis with 14 cited sources.
🔑 Enhanced Key Takeaways
- •The interactive star map was created by a developer named Val, who utilized a Python script to render the 1.8+ billion stars from the GAIA DR3 dataset into custom images for the skybox, providing a highly detailed background.
- •The map specifically recreates the in-ship navigation computer from Andy Weir's novel Project Hail Mary and includes a blinking dot to indicate the location of the Hail Mary spacecraft at Tau Ceti.
- •While currently static, the developer intends to enhance the map with features such as a simulation of the full journey and a brachistochrone constant acceleration/deceleration, further immersing users in the novel's narrative.
- •Beyond the dense skybox, the map renders 53,836 individual 3D star bodies, demonstrating a layered approach to visualizing vast astronomical data efficiently.
🛠️ Technical Deep Dive
- The project leverages the ESA GAIA DR3 dataset, which includes astrometric solutions, photometric data, radial velocities, and astrophysical parameters for nearly 2 billion celestial objects.
- A Python script is used to process the GAIA DR3 data, rendering 1.8+ billion stars into custom images that form the interactive map's skybox.
- Star positions and colors within the visualization are derived directly from the GAIA data, with minor exceptions for a few bright stars not included in the dataset.
- The interactive 3D environment is likely built using web technologies such as WebGL and a JavaScript library like Three.js, enabling real-time rendering even on mobile devices.
- The map displays 53,836 distinct 3D star objects in the foreground, complementing the high-density background generated from the full GAIA DR3 dataset.
🔮 Future ImplicationsAI analysis grounded in cited sources
⏳ Timeline
📎 Sources (14)
Factual claims are grounded in the sources below. Forward-looking analysis is AI-generated interpretation.
Weekly AI Recap
Read this week's curated digest of top AI events →
👉Related Updates
Same topic
Explore #data-visualization
Same product
More on project-hail-mary-star-map
Same source
Latest from Digital Trends
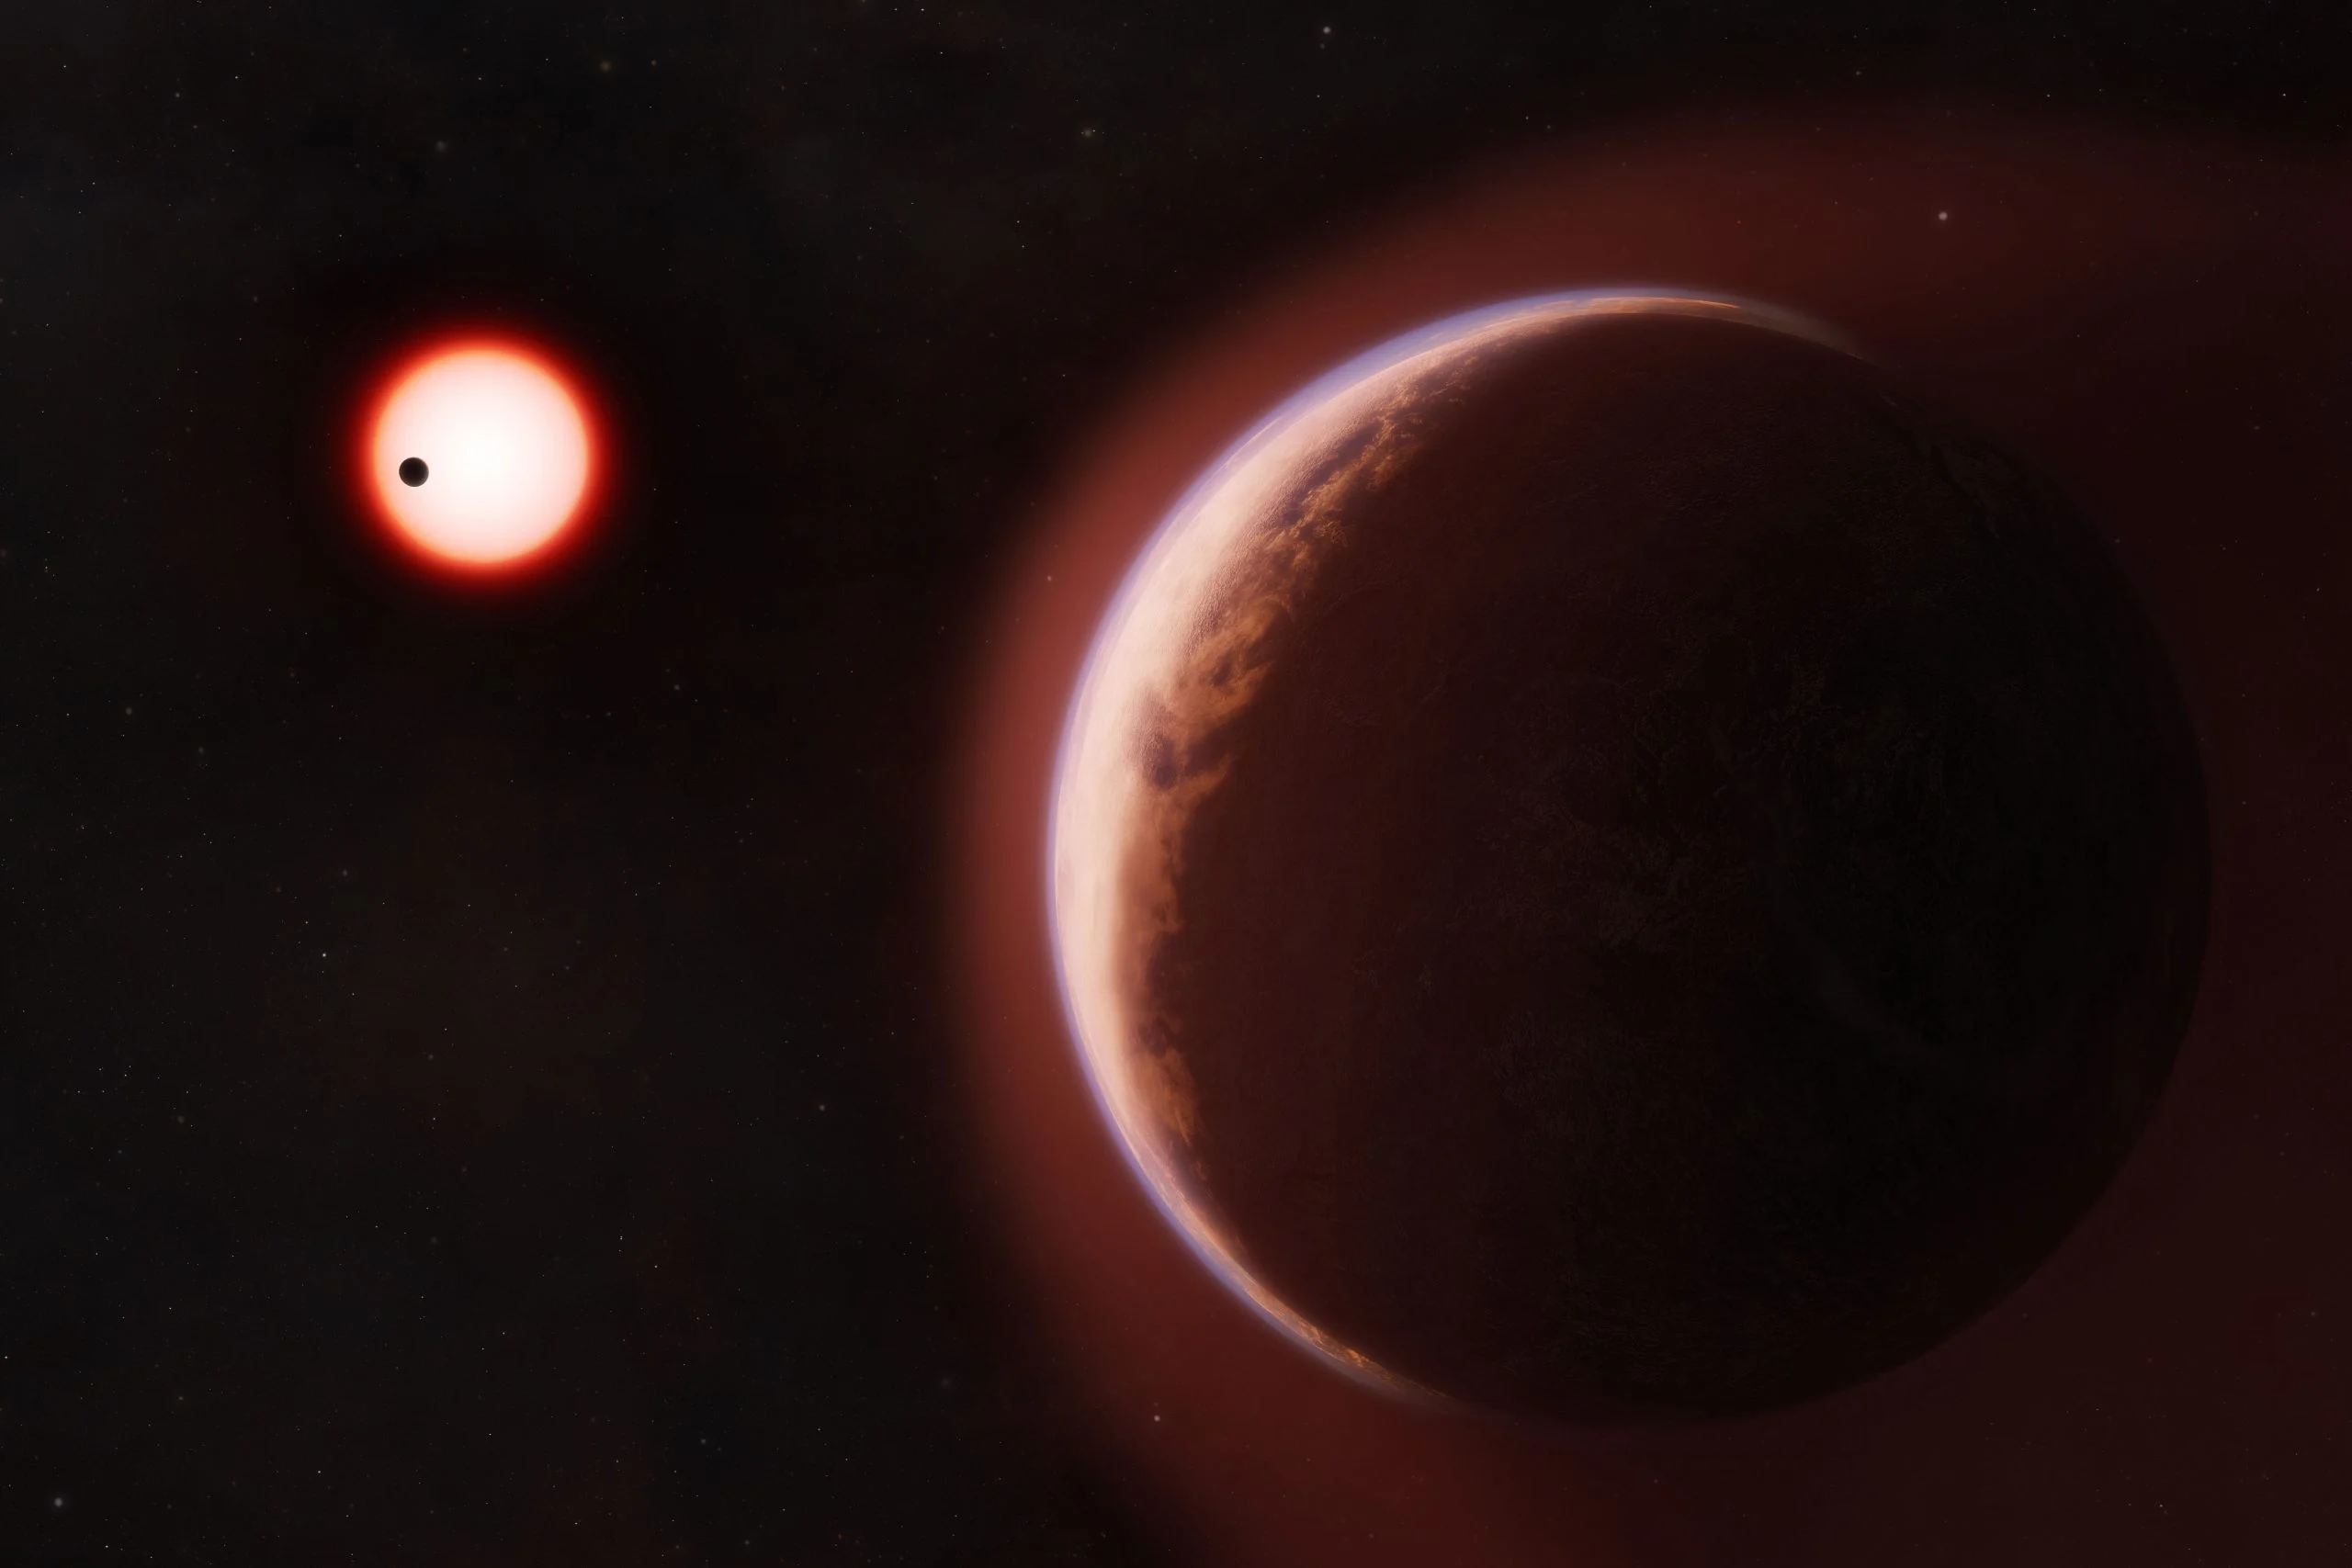
First atmosphere detected on habitable-zone exoplanet
Wispr Flow addresses user feedback with UI improvements

Pixel 11 Pro models may feature smaller batteries

Apple Prepares Major Smart Home Product Refresh This Fall
AI-curated news aggregator. All content rights belong to original publishers.
Original source: Digital Trends ↗