Query Profiling: See Where a Slow Query Spends Its Time
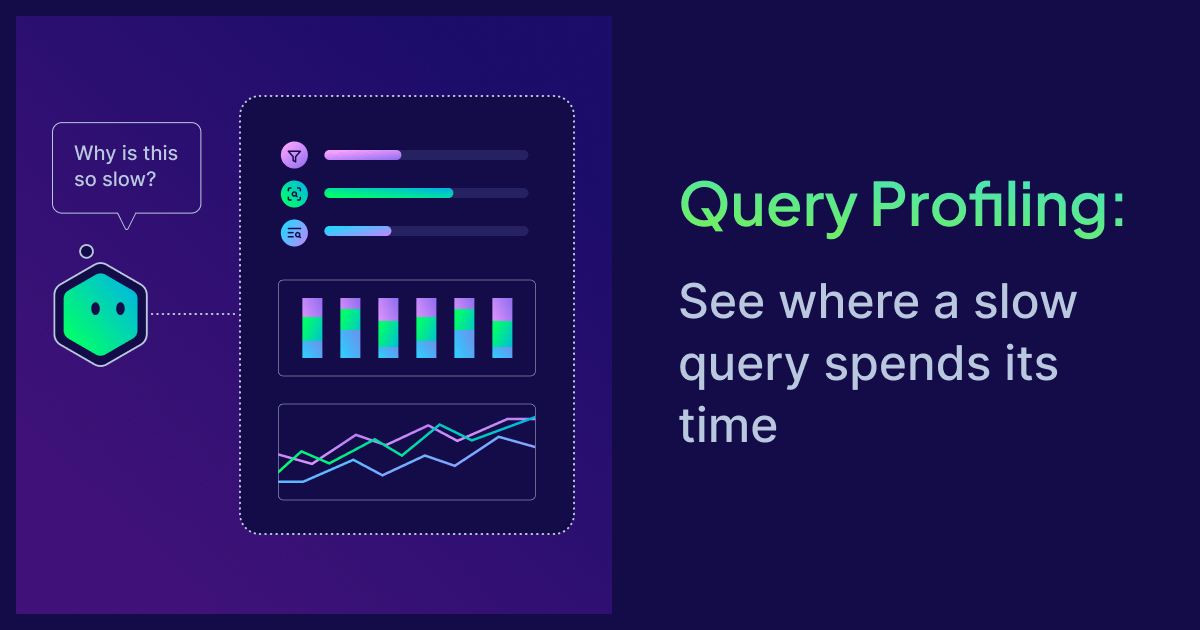
💡Stop guessing why your vector search is slow; use Weaviate's new profiling tool to get exact latency metrics.
⚡ 30-Second TL;DR
What Changed
Provides per-stage timing breakdown for query execution.
Why It Matters
This tool significantly reduces the time spent on performance tuning for large-scale vector databases. It allows engineers to pinpoint whether latency is caused by specific shards or internal processing stages.
What To Do Next
Enable query profiling in your Weaviate instance to audit your most latency-sensitive vector search queries.
Key Points
- •Provides per-stage timing breakdown for query execution.
- •Offers per-shard performance visibility to isolate slow nodes.
- •Enables faster debugging of latency issues in vector search.
🧠 Deep Insight
AI-generated analysis for this event — not the original article.
🔑 Enhanced Key Takeaways
- •Query profiling in Weaviate integrates directly with the existing observability stack, allowing users to export timing data to tools like Prometheus or Grafana.
- •The feature utilizes internal tracing spans to measure execution time across different vector search algorithms, such as HNSW, specifically highlighting index traversal versus distance calculation latency.
- •It addresses the 'black box' nature of distributed vector databases by exposing the overhead introduced by network communication between coordinator and worker nodes.
- •The implementation includes a threshold-based trigger mechanism that automatically captures profiles for queries exceeding a user-defined latency limit.
- •This profiling capability supports multi-tenant environments by allowing administrators to correlate slow query performance with specific tenant IDs or partition keys.
📊 Competitor Analysis▸ Show
| Feature | Weaviate (Query Profiling) | Pinecone (Query Insights) | Milvus (Query Profiling) |
|---|---|---|---|
| Granularity | Per-stage/Per-shard | Per-query/Per-index | Per-node/Per-segment |
| Pricing | Open Source/Cloud | Managed Service | Open Source/Cloud |
| Benchmarking | Integrated Tracing | Dashboard-based | Log-based/Metrics |
🛠️ Technical Deep Dive
- The profiling mechanism leverages OpenTelemetry standards to instrument internal query execution paths.
- It captures latency metrics at the gRPC layer, allowing for the differentiation between serialization overhead and actual vector search computation.
- The per-shard breakdown is achieved by aggregating timing data from the distributed query coordinator, which collects spans from all participating shards in a cluster.
- Profiling data is stored in a transient buffer to minimize performance impact on production workloads, with a configurable sampling rate.
🔮 Future ImplicationsAI analysis grounded in cited sources
⏳ Timeline
Weekly AI Recap
Read this week's curated digest of top AI events →
👉Related Updates
AI-curated news aggregator. All content rights belong to original publishers.
Original source: Weaviate Blog ↗
This is a summary, not the original. Read the source, or get the weekly briefing.
The weekly digest
One email a week. Unsubscribe anytime.