Monitor Codex Usage with CloudWatch
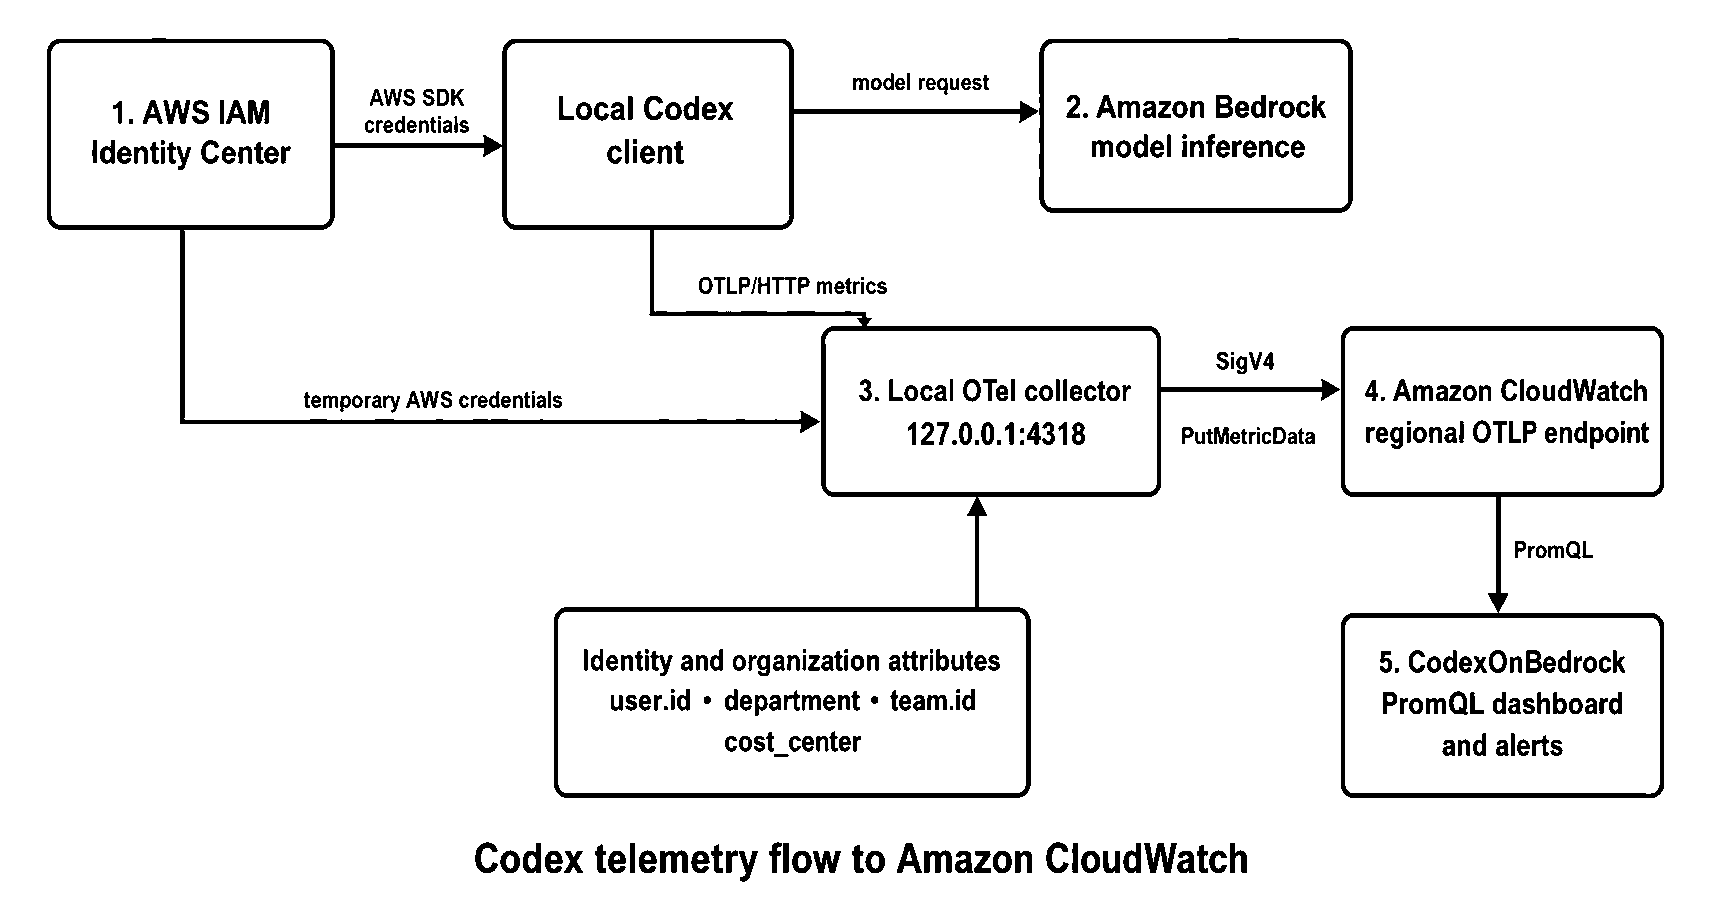
Turn Codex telemetry into AWS-native dashboards for adoption, cost, and reliability.
30-Second TL;DR
What Changed
Codex OpenTelemetry metrics can be routed through a local collector.
Why It Matters
Centralized visibility can help organizations allocate coding-agent costs, identify adoption patterns, and detect reliability issues. It also gives platform teams a practical foundation for governing Codex usage at scale.
What To Do Next
Deploy a local OpenTelemetry Collector for Codex and export a test set of metrics to Amazon CloudWatch, grouped by team and cost center.
Key Points
- •Codex OpenTelemetry metrics can be routed through a local collector.
- •Amazon CloudWatch provides an AWS-native dashboard for coding-agent observability.
- •Usage can be analyzed by user, team, and cost center alongside adoption and reliability.
Deep Insight
AI-generated analysis for this event — not the original article.
Enhanced Key Takeaways
- •The integration leverages the OpenTelemetry (OTel) Collector's OTLP exporter to bridge Codex-specific telemetry data with the Amazon CloudWatch agent.
- •By tagging metrics with custom attributes like 'team_id' or 'cost_center', organizations can utilize CloudWatch Contributor Insights to identify top consumers of AI coding resources in real-time.
- •This observability pattern supports the monitoring of token consumption rates, which is critical for managing budget thresholds in high-scale AI development environments.
- •The architecture supports multi-account observability, allowing centralized AWS accounts to aggregate Codex usage metrics across an entire enterprise organization.
- •Implementation requires configuring the OTel Collector's 'awscloudwatch' exporter, which automatically handles the batching and compression of telemetry data before ingestion into AWS.
Competitor Analysis
- AWS CloudWatch (Codex)
- Deep AWS Ecosystem
- Datadog AI Observability
- Platform Agnostic
- New Relic AI Monitoring
- Platform Agnostic
- AWS CloudWatch (Codex)
- Pay-per-metric/log
- Datadog AI Observability
- Per-host/Per-token
- New Relic AI Monitoring
- Per-GB/Per-user
- AWS CloudWatch (Codex)
- CloudWatch Dashboards
- Datadog AI Observability
- AI-Specific Out-of-the-box
- New Relic AI Monitoring
- AI-Specific Out-of-the-box
- AWS CloudWatch (Codex)
- AWS-centric teams
- Datadog AI Observability
- Multi-cloud enterprises
- New Relic AI Monitoring
- Full-stack observability
| Feature | AWS CloudWatch (Codex) | Datadog AI Observability | New Relic AI Monitoring |
|---|---|---|---|
| Native Integration | Deep AWS Ecosystem | Platform Agnostic | Platform Agnostic |
| Pricing Model | Pay-per-metric/log | Per-host/Per-token | Per-GB/Per-user |
| Dashboarding | CloudWatch Dashboards | AI-Specific Out-of-the-box | AI-Specific Out-of-the-box |
| Best For | AWS-centric teams | Multi-cloud enterprises | Full-stack observability |
Technical Deep Dive
- The solution utilizes the OpenTelemetry Collector (OTel) as a middleware layer to receive gRPC or HTTP/Protobuf traces and metrics from the Codex environment.
- Metrics are mapped to CloudWatch namespaces using the OTel 'awscloudwatch' exporter, which requires IAM permissions for 'cloudwatch:PutMetricData'.
- The configuration involves defining a 'pipeline' in the collector's YAML file that specifies receivers (OTLP), processors (batch/attributes), and exporters (awscloudwatch).
- Custom dimensions are injected via the 'attributes' processor to ensure that metrics are searchable by specific metadata tags like 'user_id' or 'project_id'.
- The setup supports high-cardinality data by leveraging CloudWatch Metric Math to aggregate usage trends over specific time windows.
Future ImplicationsAI analysis grounded in cited sources
Timeline
- 2021-08OpenAI announces the private beta of Codex via API.
- 2022-06GitHub Copilot, powered by Codex, becomes generally available.
- 2023-03AWS announces Amazon CodeWhisperer, competing with Codex-based tools.
- 2024-11AWS expands observability support for third-party AI models in CloudWatch.
- 2026-08AWS publishes guidance on monitoring Codex usage via OpenTelemetry and CloudWatch.
Weekly AI Recap
Read this week's curated digest of top AI events →
Related Updates

AI-curated news aggregator. All content rights belong to original publishers.
Original source: AWS Machine Learning Blog ↗
This is a summary, not the original. Read the source, or get the weekly briefing.
The weekly digest
One email a week. Unsubscribe anytime.