Microsoft Makes Windows Performance Analysis Easier
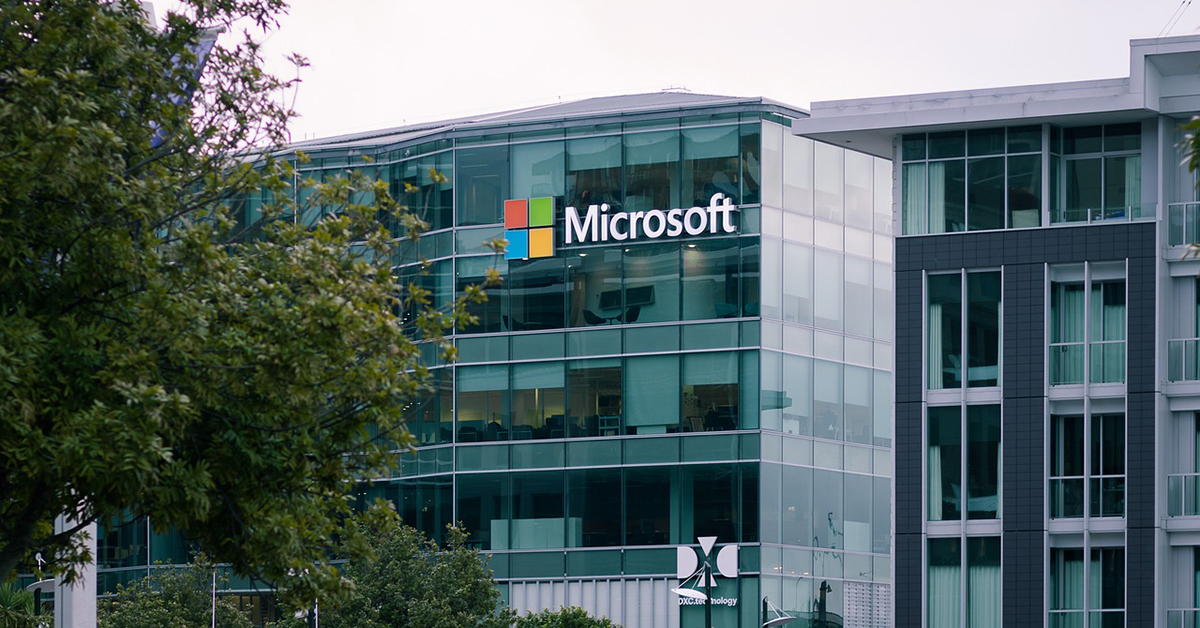
Diagnose slow Windows systems faster without requiring deep performance-analysis expertise.
30-Second TL;DR
What Changed
The tool targets slow Windows performance and high system load.
Why It Matters
Simplifying performance diagnosis could shorten incident-resolution times and reduce dependence on specialized Windows administrators. For enterprises deploying AI workloads on Windows, faster diagnosis may improve endpoint and workstation reliability.
What To Do Next
Pilot Microsoft's new Windows performance-analysis tool on one slow AI development workstation and compare its root-cause findings with your existing log workflow.
Key Points
- •The tool targets slow Windows performance and high system load.
- •It is designed for users without advanced performance-analysis expertise.
- •The tool addresses log-analysis and root-cause identification challenges faced by IT teams.
Deep Insight
AI-generated analysis for this event — not the original article.
Enhanced Key Takeaways
- •The tool is integrated into the Windows Performance Toolkit (WPT) ecosystem, specifically leveraging the Windows Performance Recorder (WPR) and Windows Performance Analyzer (WPA) frameworks.
- •It utilizes AI-driven heuristic analysis to automatically correlate Event Tracing for Windows (ETW) logs with known system bottlenecks.
- •Microsoft has implemented a 'natural language query' interface, allowing IT administrators to ask questions like 'Why is my CPU spiking?' instead of manually filtering complex trace files.
- •The solution includes a cloud-based telemetry component that allows organizations to compare their system performance metrics against anonymized industry benchmarks.
- •It supports automated remediation suggestions, providing direct links to relevant Microsoft Knowledge Base articles or configuration scripts based on the identified root cause.
Competitor Analysis
- Microsoft Performance Tool
- IT Admins / Generalist
- Dynatrace
- Enterprise DevOps
- New Relic
- Full-stack Engineers
- Splunk ITSI
- Security/Ops Analysts
- Microsoft Performance Tool
- Included in Windows/Azure
- Dynatrace
- High (Consumption-based)
- New Relic
- Mid-High (Per user/GB)
- Splunk ITSI
- High (Data volume)
- Microsoft Performance Tool
- High (Low-code)
- Dynatrace
- Moderate
- New Relic
- Moderate
- Splunk ITSI
- Low (Requires setup)
| Feature | Microsoft Performance Tool | Dynatrace | New Relic | Splunk ITSI |
|---|---|---|---|---|
| Target Audience | IT Admins / Generalist | Enterprise DevOps | Full-stack Engineers | Security/Ops Analysts |
| Pricing | Included in Windows/Azure | High (Consumption-based) | Mid-High (Per user/GB) | High (Data volume) |
| Ease of Use | High (Low-code) | Moderate | Moderate | Low (Requires setup) |
Technical Deep Dive
- Utilizes ETW (Event Tracing for Windows) as the primary data ingestion layer for real-time kernel and user-mode event capture.
- Employs a local inference engine to process trace files, ensuring sensitive system data does not necessarily leave the local environment unless cloud telemetry is enabled.
- Integrates with the Windows Management Instrumentation (WMI) and CIM (Common Information Model) providers to correlate performance data with hardware state.
- Uses a proprietary machine learning model trained on millions of Windows crash and performance dump files to identify common patterns in high-latency scenarios.
- Supports command-line interface (CLI) automation for integration into CI/CD pipelines and automated system health checks.
Future ImplicationsAI analysis grounded in cited sources
Timeline
- 2005-06Microsoft releases the initial Windows Performance Toolkit (WPT) for Windows Vista.
- 2012-08Windows Performance Analyzer (WPA) is introduced as a standalone tool for deep system analysis.
- 2019-09Microsoft releases WPA as an app on the Microsoft Store to simplify updates and distribution.
- 2024-11Microsoft announces AI-driven diagnostic capabilities for Windows 11 enterprise environments.
- 2026-08Microsoft launches the simplified performance analysis tool for general IT administrators.
Weekly AI Recap
Read this week's curated digest of top AI events →
Related Updates
AI-curated news aggregator. All content rights belong to original publishers.
Original source: ITmedia AI+ (日本) ↗
This is a summary, not the original. Read the source, or get the weekly briefing.
The weekly digest
One email a week. Unsubscribe anytime.