Centralized observability for enterprise AI platforms
Struggling to track AI platform ROI? Learn how to build centralized observability for your enterprise AI.
30-Second TL;DR
What Changed
Provides visibility into user satisfaction and platform engagement metrics
Why It Matters
By providing clear metrics on AI usage, this solution helps enterprises justify AI spending and optimize platform capabilities based on real user feedback.
What To Do Next
Audit your current AI platform logs and evaluate if integrating them into a centralized observability dashboard could improve your ROI reporting.
Key Points
- •Provides visibility into user satisfaction and platform engagement metrics
- •Centralizes scattered data from multiple AWS services into one dashboard
- •Enables business leaders to track the ROI of enterprise AI investments
Deep Insight
Background and context from public sources — not the original article. 23 sources cited.
Enhanced Key Takeaways
- •Amazon Quick is an AI assistant and workspace that enables users to build custom web applications and automate workflows using natural language, integrating with a wide array of third-party business applications like Google Workspace, Salesforce, and Microsoft 365.
- •The observability solution provides end-to-end tracing for generative AI applications, encompassing Large Language Models (LLMs), agents, knowledge bases, and tools, to offer deep insights into their performance, health, and accuracy.
- •It supports monitoring of AI agents developed using various frameworks, including LangChain, Amazon Bedrock, custom orchestration, or hybrid systems, and integrates with the OpenTelemetry standard for telemetry data collection.
- •The platform offers pre-built dashboards that track crucial generative AI metrics such as token usage, latency, and error rates, significantly aiding in faster debugging and quality audits.
- •Centralized observability for AI/ML workloads within AWS environments often leverages services like Amazon SageMaker Model Monitor and CloudWatch cross-account observability to aggregate metrics, logs, and traces from multiple AWS accounts into a unified view.
Competitor Analysis
- Amazon Quick (AWS)
- AI assistant, low-code app builder, workflow automation with integrated observability for AI agents.
- MLflow
- Open-source platform for the full ML lifecycle: experiment tracking, model registry, observability, evaluation, prompt optimization, governance.
- Weights & Biases (W&B)
- Experiment tracking, real-time visualization, collaboration, LLM application monitoring (Weave).
- Arize AI / Phoenix
- Observability and monitoring for production ML systems, detecting model bias, performance degradation, data drift, LLM observability.
- LangSmith
- Observability layer for LLM applications, tracing LLM calls, chain steps, agent tool invocations, RAG retrieval, evaluation.
- Amazon Quick (AWS)
- Centralizes scattered data from multiple AWS services into one dashboard; monitors agent interactions, flow triggers, outcomes, user usage. Leverages CloudWatch genAI observability for end-to-end tracing.
- MLflow
- Provides an OpenTelemetry-native observability layer for a complete AI engineering platform.
- Weights & Biases (W&B)
- W&B Weave extends capabilities to LLM application monitoring, tracing LLM calls, tracking evaluation scores.
- Arize AI / Phoenix
- Robust visual analytics and real-time alerting for ML systems; open-source Phoenix for observability.
- LangSmith
- Captures every LLM call, chain step, agent tool invocation as a structured trace with inputs, outputs, latency, token usage, and cost.
- Amazon Quick (AWS)
- Monitors fleet of AI agents from 'AgentCore' tab in CloudWatch genAI observability console; end-to-end view of agent behavior, reasoning, inputs, outputs, tool usage.
- MLflow
- Built for teams needing to get agents into production and keep them there, covering the full lifecycle.
- Weights & Biases (W&B)
- W&B Weave for LLM application monitoring, including agent tool invocations.
- Arize AI / Phoenix
- Expanding into GenAI space, with strengths in built-in evaluation metrics, drift detection, and trace analytics.
- LangSmith
- Default observability layer for LLM applications, capturing every agent tool invocation.
- Amazon Quick (AWS)
- Integrates with Google Workspace, Zoom, Microsoft 365, Salesforce, Slack, Teams, Jira, ServiceNow. Leverages AWS services like Bedrock, CloudWatch.
- MLflow
- Universal, no vendor lock-in; integrates with Kubeflow, Feast.
- Weights & Biases (W&B)
- Strong integration with its own training visualization tools.
- Arize AI / Phoenix
- Open-source Phoenix; integrates with existing ML monitoring.
- LangSmith
- From the LangChain team, deeply integrated with LangChain framework.
- Amazon Quick (AWS)
- Free to start, no AWS account or credit card required for basic use; cost per agent hour + small infra fee for Quick Suite.
- MLflow
- Open-source (free), with commercial offerings from Databricks.
- Weights & Biases (W&B)
- Commercial platform, with free tiers/community editions.
- Arize AI / Phoenix
- Commercial platform (Arize AI), open-source (Phoenix).
- LangSmith
- Commercial platform, from LangChain, Inc.
- Amazon Quick (AWS)
- N/A
- MLflow
- N/A
- Weights & Biases (W&B)
- N/A
- Arize AI / Phoenix
- N/A
- LangSmith
- N/A
| Feature/Category | Amazon Quick (AWS) | MLflow | Weights & Biases (W&B) | Arize AI / Phoenix | LangSmith |
|---|---|---|---|---|---|
| Primary Focus | AI assistant, low-code app builder, workflow automation with integrated observability for AI agents. | Open-source platform for the full ML lifecycle: experiment tracking, model registry, observability, evaluation, prompt optimization, governance. | Experiment tracking, real-time visualization, collaboration, LLM application monitoring (Weave). | Observability and monitoring for production ML systems, detecting model bias, performance degradation, data drift, LLM observability. | Observability layer for LLM applications, tracing LLM calls, chain steps, agent tool invocations, RAG retrieval, evaluation. |
| Centralized Observability | Centralizes scattered data from multiple AWS services into one dashboard; monitors agent interactions, flow triggers, outcomes, user usage. Leverages CloudWatch genAI observability for end-to-end tracing. | Provides an OpenTelemetry-native observability layer for a complete AI engineering platform. | W&B Weave extends capabilities to LLM application monitoring, tracing LLM calls, tracking evaluation scores. | Robust visual analytics and real-time alerting for ML systems; open-source Phoenix for observability. | Captures every LLM call, chain step, agent tool invocation as a structured trace with inputs, outputs, latency, token usage, and cost. |
| AI Agent Monitoring | Monitors fleet of AI agents from 'AgentCore' tab in CloudWatch genAI observability console; end-to-end view of agent behavior, reasoning, inputs, outputs, tool usage. | Built for teams needing to get agents into production and keep them there, covering the full lifecycle. | W&B Weave for LLM application monitoring, including agent tool invocations. | Expanding into GenAI space, with strengths in built-in evaluation metrics, drift detection, and trace analytics. | Default observability layer for LLM applications, capturing every agent tool invocation. |
| Integration & Ecosystem | Integrates with Google Workspace, Zoom, Microsoft 365, Salesforce, Slack, Teams, Jira, ServiceNow. Leverages AWS services like Bedrock, CloudWatch. | Universal, no vendor lock-in; integrates with Kubeflow, Feast. | Strong integration with its own training visualization tools. | Open-source Phoenix; integrates with existing ML monitoring. | From the LangChain team, deeply integrated with LangChain framework. |
| Pricing Model | Free to start, no AWS account or credit card required for basic use; cost per agent hour + small infra fee for Quick Suite. | Open-source (free), with commercial offerings from Databricks. | Commercial platform, with free tiers/community editions. | Commercial platform (Arize AI), open-source (Phoenix). | Commercial platform, from LangChain, Inc. |
| Benchmarks | N/A | N/A | N/A | N/A | N/A |
Technical Deep Dive
- End-to-End Tracing: The solution provides end-to-end tracing across all components of generative AI applications, including Large Language Models (LLMs), agents, knowledge bases, and various tools.
- Metrics Monitored: Key metrics for generative AI workloads include token usage (input/output/total consumption per task and model), latency across reasoning, tools, and external systems, and error rates (tool failures, timeouts, model-level issues).
- OpenTelemetry Integration: The system works with open-source agentic frameworks such as Strands Agents, LangGraph, and CrewAI that emit telemetry data in a standardized OpenTelemetry (OTEL)-compatible format.
- Automated Instrumentation: The AWS Distro for OpenTelemetry (ADOT) SDK automatically instruments AI Agents to capture telemetry data, sending it directly to CloudWatch OTLP endpoints without requiring manual code changes.
- Centralized Data Aggregation: For multi-account AWS environments, a central 'Observability account' aggregates metrics, logs, and traces from 'Source accounts' using CloudWatch cross-account observability.
- Debugging Capabilities: Features include end-to-end prompt tracing, allowing deeper dives with filters for timing, tool usage, and knowledge lookups within the CloudWatch console.
- Underlying AWS Services: The solution integrates with existing CloudWatch features like Application Signals, Alarms, Dashboards, and Logs Insights for comprehensive monitoring of both AI applications and underlying infrastructure.
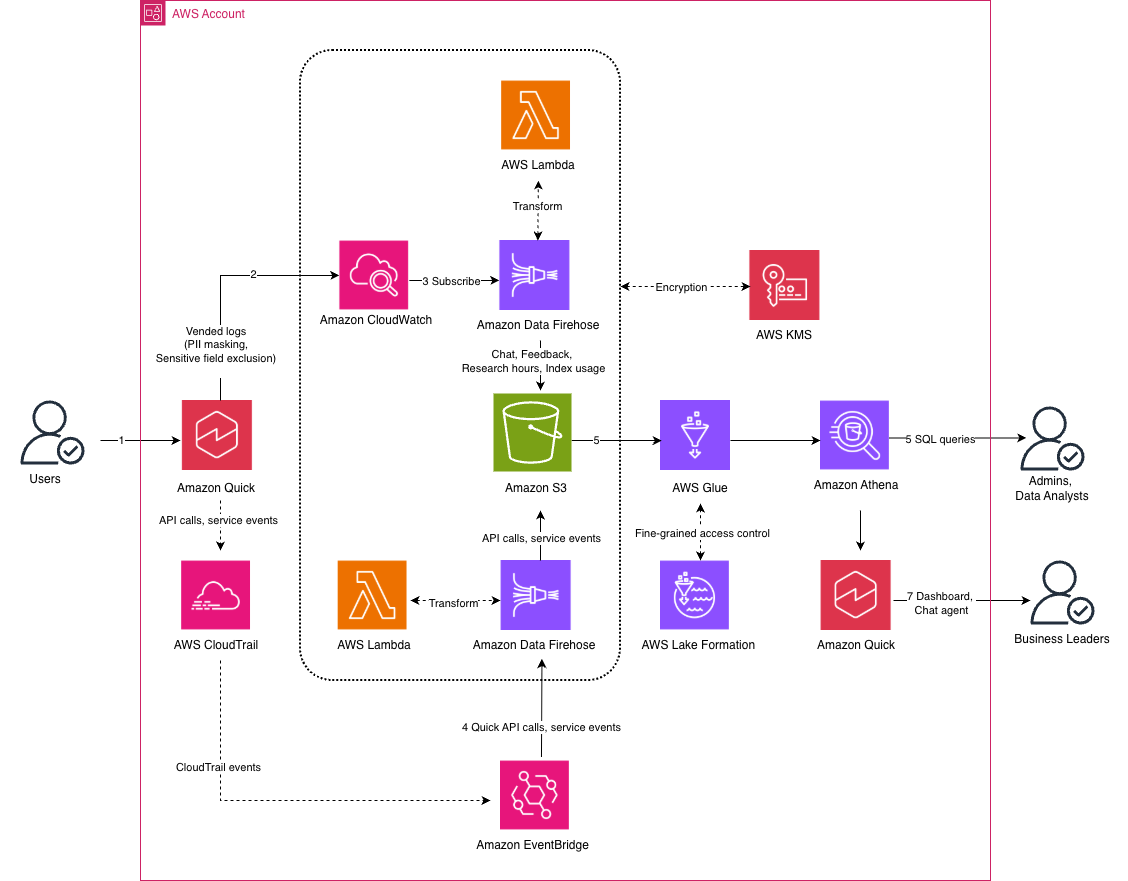
- Data Storage and Analysis: Observability data can be stored in Amazon S3 for long-term retention, with AWS Glue Data Catalog enabling serverless SQL queries via Amazon Athena.
Future ImplicationsAI analysis grounded in cited sources
Timeline
- 2002AWS launched, laying the foundation for cloud services.
- 2015Amazon Machine Learning service launched, making ML accessible to businesses.
- 2017Amazon SageMaker launched, simplifying the ML lifecycle for developers and data scientists.
- 2024-10AWS blog post on centralized observability with Amazon SageMaker and Amazon CloudWatch, outlining multi-account monitoring strategies.
- 2025-07Amazon CloudWatch generative AI observability (Preview) launched, offering out-of-the-box views and end-to-end tracing for generative AI applications.
- 2025-10Amazon Quick Suite (later referred to as Amazon Quick) reached general availability, providing an agentic AI-powered workspace.
- 2026-04AWS announced new features in preview for Amazon Quick, including the ability to create custom web applications using natural language, and launched a new desktop app for Amazon Quick.
Sources (23)
Factual claims are grounded in the sources below. Forward-looking analysis is AI-generated interpretation.
Weekly AI Recap
Read this week's curated digest of top AI events →
AI-curated news aggregator. All content rights belong to original publishers.
Original source: AWS Machine Learning Blog ↗
This is a summary, not the original. Read the source, or get the weekly briefing.
The weekly digest
One email a week. Unsubscribe anytime.