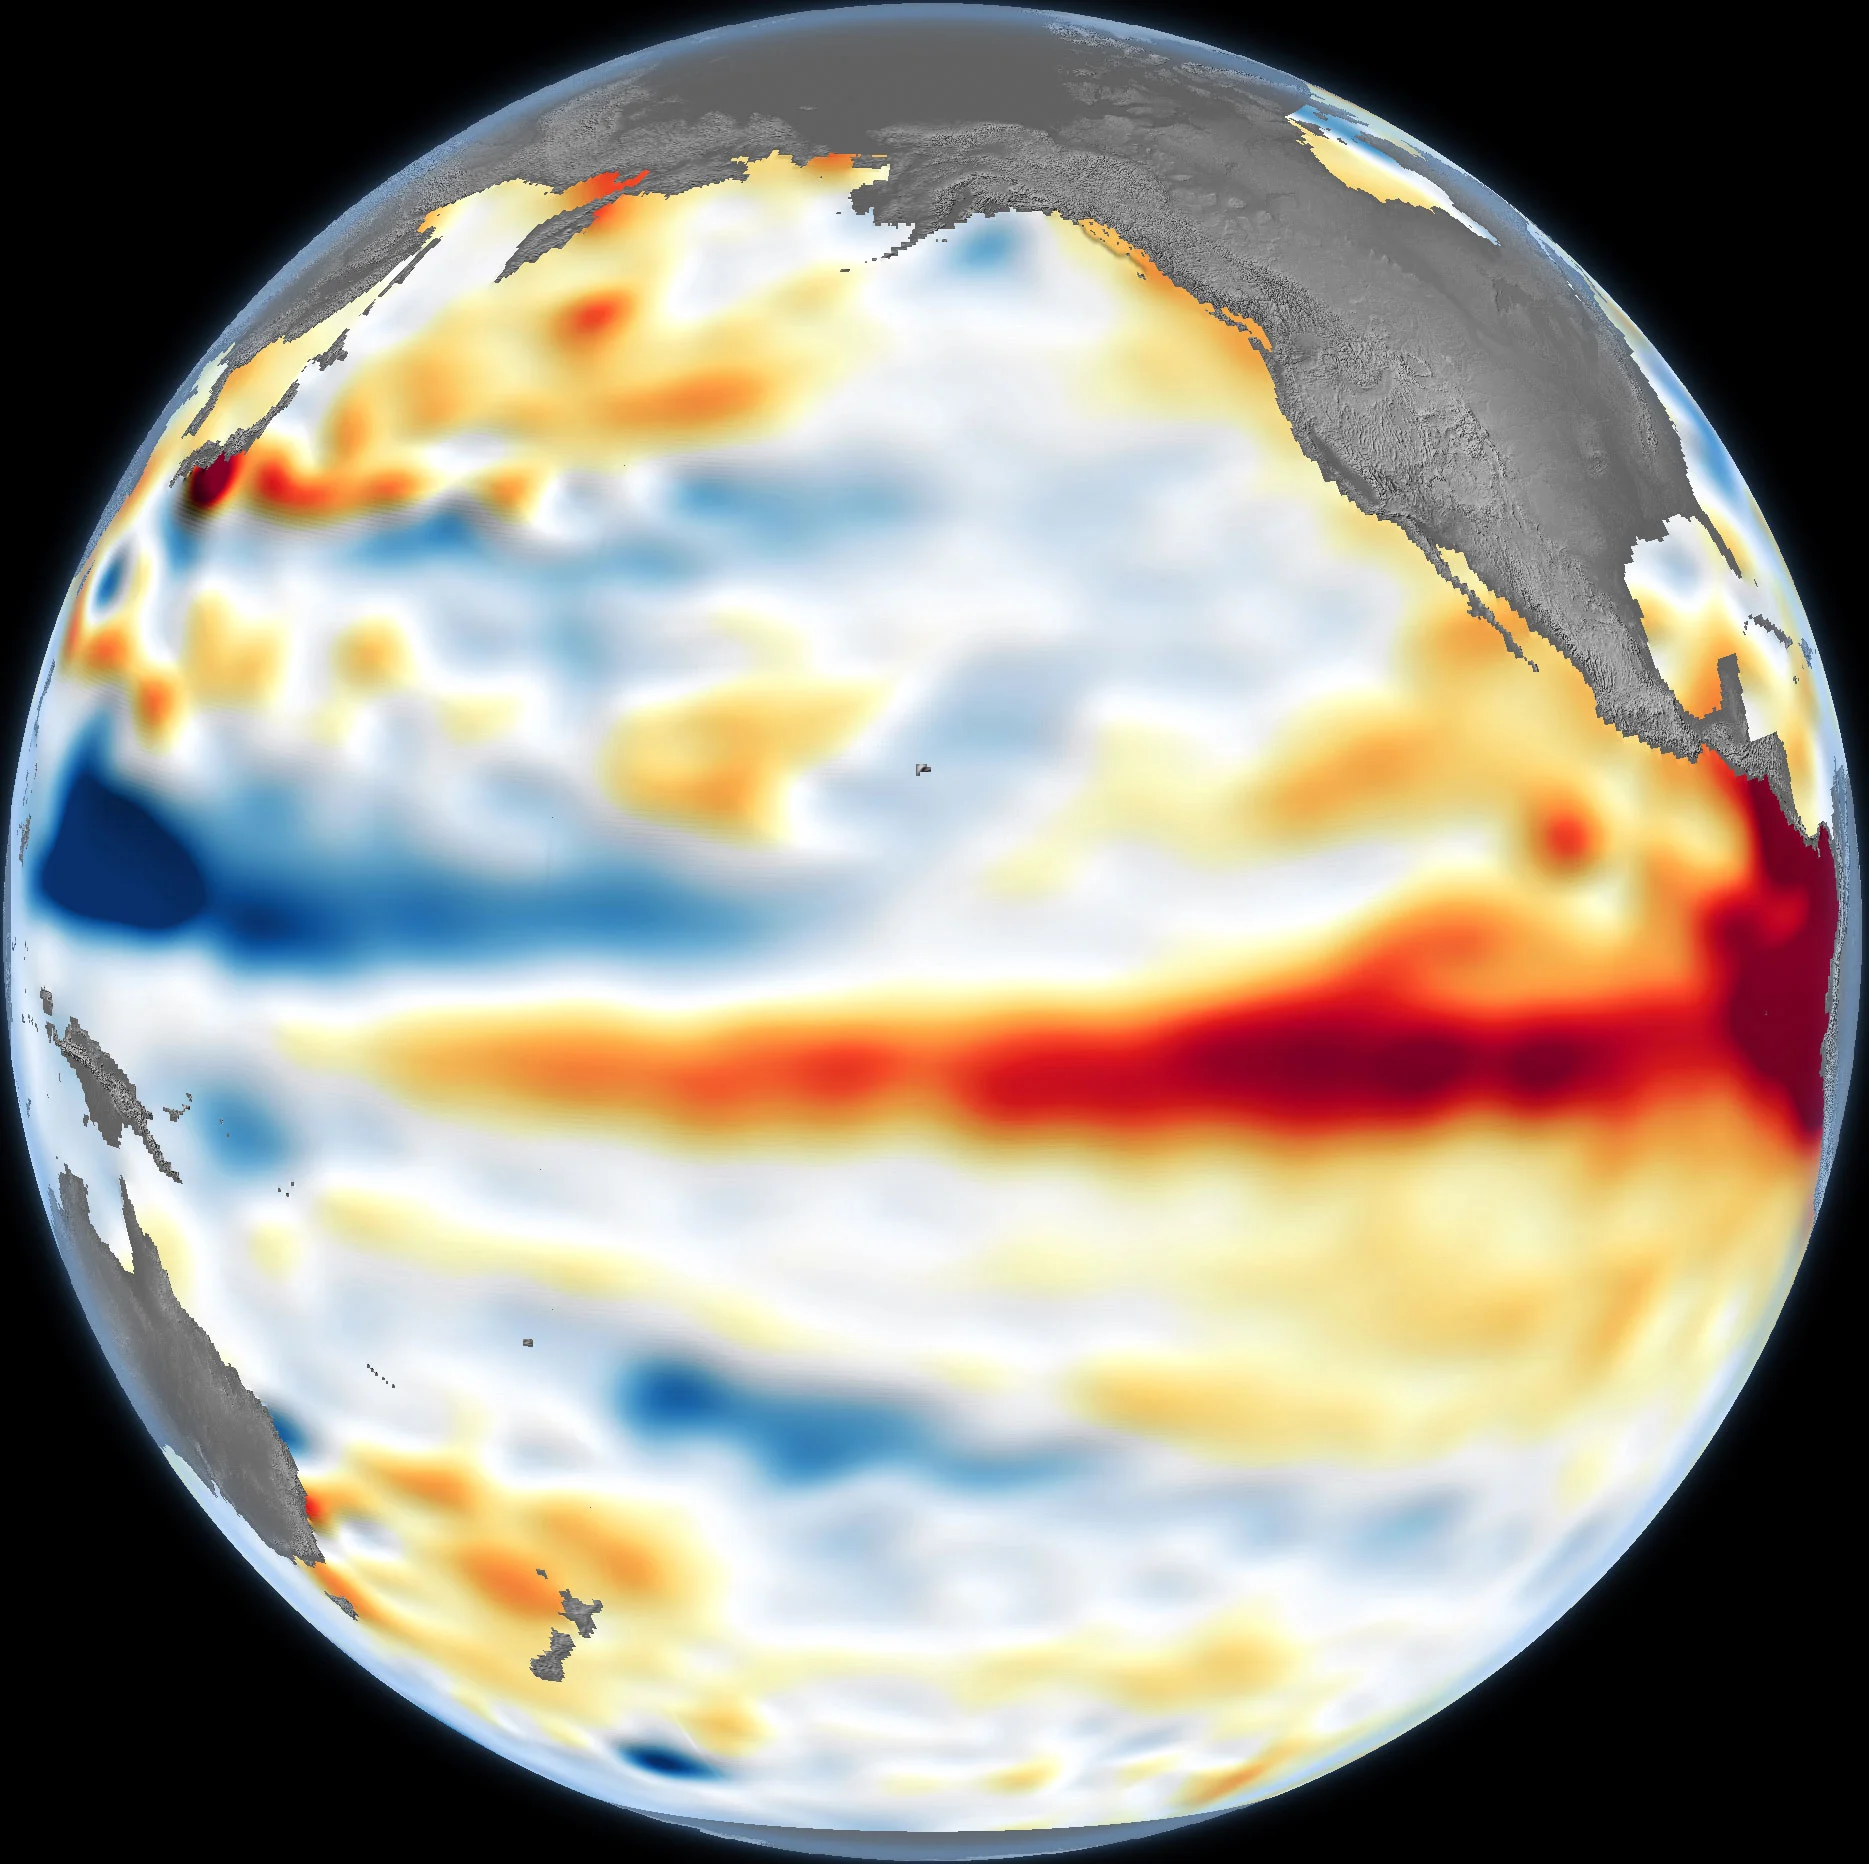
NASA Satellites Detect Strong El Niño Brewing
💡Critical climate data for building robust supply chain and commodity price prediction models.
⚡ 30-Second TL;DR
What Changed
NOAA officially declared the return of El Niño as of June 11, 2026.
Why It Matters
El Niño events significantly disrupt global supply chains and agricultural yields, which are critical variables for predictive AI models in logistics and commodity trading.
What To Do Next
Integrate NOAA's real-time climate API data into your supply chain risk assessment models to account for El Niño-driven volatility.
Key Points
- •NOAA officially declared the return of El Niño as of June 11, 2026.
- •Sea surface temperatures have been at least 0.5°C above normal for several months.
- •NASA satellite monitoring is tracking the deep-ocean thermal anomalies.
🧠 Deep Insight
AI-generated analysis for this event — not the original article.
🔑 Enhanced Key Takeaways
- •The 2026 El Niño event is being characterized by meteorologists as a 'rapid-onset' cycle, differing from the slower development patterns observed in the 2015-2016 super El Niño.
- •Data from the Sentinel-6 Michael Freilich satellite indicates that sea level height anomalies in the Pacific have risen by over 10 centimeters, a key indicator of the expanded warm water volume.
- •Agricultural commodity markets, particularly for coffee and palm oil, have already begun pricing in potential supply chain disruptions in Southeast Asia and South America due to anticipated drought conditions.
- •The current event is occurring against a backdrop of record-high global ocean heat content, which climate scientists suggest may amplify the intensity of the El Niño's atmospheric teleconnections.
- •NOAA's Climate Prediction Center has issued an 'El Niño Advisory,' signaling that the phenomenon is expected to persist through the Northern Hemisphere winter of 2026-2027.
🛠️ Technical Deep Dive
- Monitoring utilizes the Jason-3 and Sentinel-6 Michael Freilich altimetry missions to measure sea surface height (SSH) with millimeter precision.
- Deep-ocean thermal anomalies are tracked using the Argo float array, a global network of nearly 4,000 autonomous robotic probes that measure temperature and salinity down to 2,000 meters.
- Satellite-based microwave radiometers, such as those on the GPM (Global Precipitation Measurement) core observatory, are used to detect changes in atmospheric water vapor and sea surface temperature (SST) even through cloud cover.
- Climate models (e.g., CFSv2) integrate real-time satellite SST data with subsurface ocean heat content to forecast the evolution of the equatorial thermocline depth.
🔮 Future ImplicationsAI analysis grounded in cited sources
⏳ Timeline
Weekly AI Recap
Read this week's curated digest of top AI events →
👉Related Updates
AI-curated news aggregator. All content rights belong to original publishers.
Original source: cnBeta (Full RSS) ↗
This is a summary, not the original. Read the source, or get the weekly briefing.
The weekly digest
One email a week. Unsubscribe anytime.