📡TechRadar AI•Stalecollected in 24m
Claude's Fun Interactive Visuals Feature
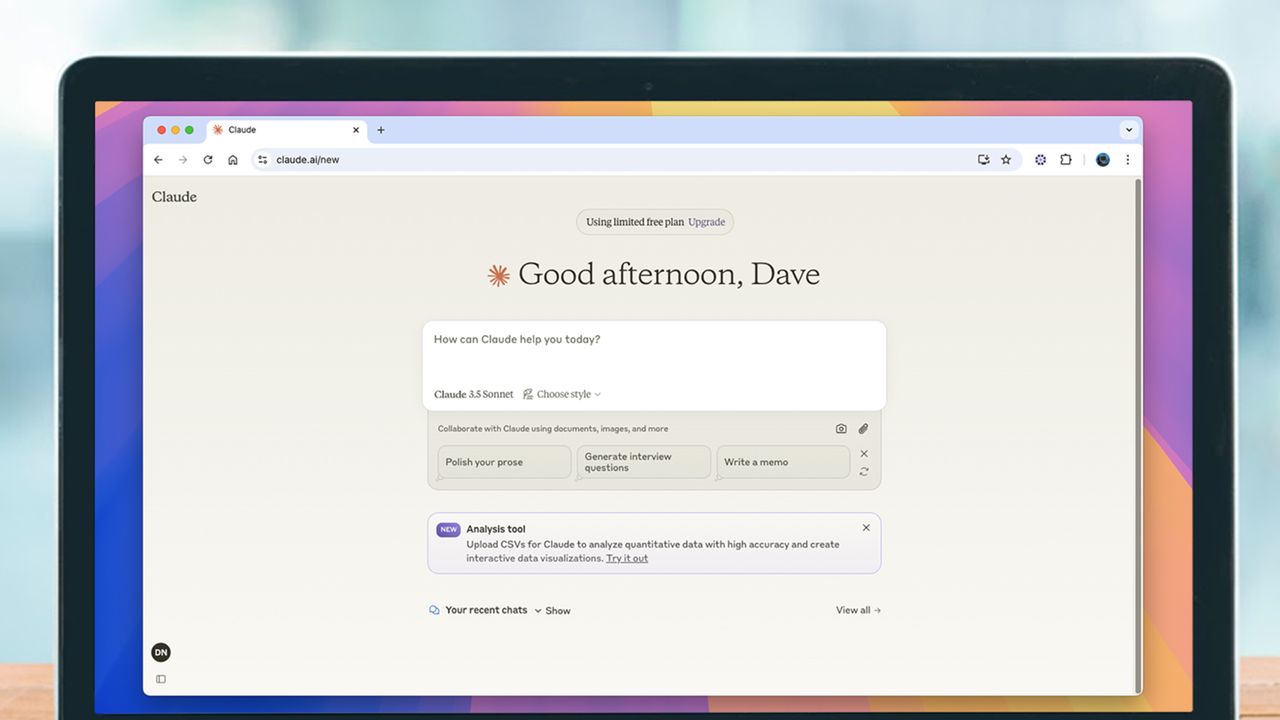
💡Claude's visuals turn chats into dynamic tools—ideal for AI builders prototyping ideas.
⚡ 30-Second TL;DR
What Changed
Generates dynamic diagrams inside Claude chats
Why It Matters
This feature makes Claude more versatile for visual explanations and prototyping, potentially increasing user adoption among builders and creators.
What To Do Next
Prompt Claude to generate an interactive diagram for your next workflow explanation.
Who should care:Developers & AI Engineers
🧠 Deep Insight
Web-grounded analysis with 5 cited sources.
🔑 Enhanced Key Takeaways
- •The feature is an expansion of Anthropic's 'Imagine with Claude' temporary experience from last year, which allowed code-free interactive visuals.[3][5]
- •Visuals use HTML and SVG for rendering, distinguishing them from image generation or Artifacts, and appear inline in responses.[4]
- •Examples include interactive periodic table diagrams, paper airplane fold guides, revenue charts from user data, weather forecasts, and recipe cards (desktop-only for some).[3][4]
📊 Competitor Analysis▸ Show
| Feature | Claude (Anthropic) | Gemini (Google) |
|---|---|---|
| Visuals Type | Interactive charts, graphs, diagrams (HTML/SVG), real-time updates | Less dynamic/complex visuals |
| Interactivity | Clickable elements, dropdowns | Updates previous responses |
| Availability | Beta, all plans including free | Not specified |
| Pricing | Free to Pro plans | Free to paid |
🛠️ Technical Deep Dive
- •Built by expanding on existing coding tools to generate visuals in real-time without exposing code to users.[2][3]
- •Uses HTML and SVG for custom charts, graphs, diagrams, and interactive elements like dropdowns and clickable portions.[4]
- •Integrates real-world data such as weather (with web search enabled) and user-provided datasets for dynamic revenue charts.[3][4]
- •Supports structured inputs like interactive multiple-choice questions and evolves visuals as conversations progress.[2][4]
🔮 Future ImplicationsAI analysis grounded in cited sources
Claude's visuals will increase user retention by 20-30% through higher engagement
Interactive, real-time diagrams reduce cognitive load compared to text, as shown in examples enhancing learning and data comprehension across sources.
Anthropic will integrate more data sources into visuals by end of 2026
Current support for weather and user data with web search suggests expansion to recipes and beyond, building on beta momentum.
⏳ Timeline
2025-09
Launched 'Imagine with Claude' temporary experience for code-free interactive visuals.
2026-03
Released interactive visuals feature in beta for all Claude users, expanding Imagine capabilities to chats.
📎 Sources (5)
Factual claims are grounded in the sources below. Forward-looking analysis is AI-generated interpretation.
📰
Weekly AI Recap
Read this week's curated digest of top AI events →
👉Related Updates
AI-curated news aggregator. All content rights belong to original publishers.
Original source: TechRadar AI ↗