Claude Beta: Inline Tables, Charts & Images
💡Free inline visuals in Claude beta—supercharge data chats for devs now.
⚡ 30-Second TL;DR
What Changed
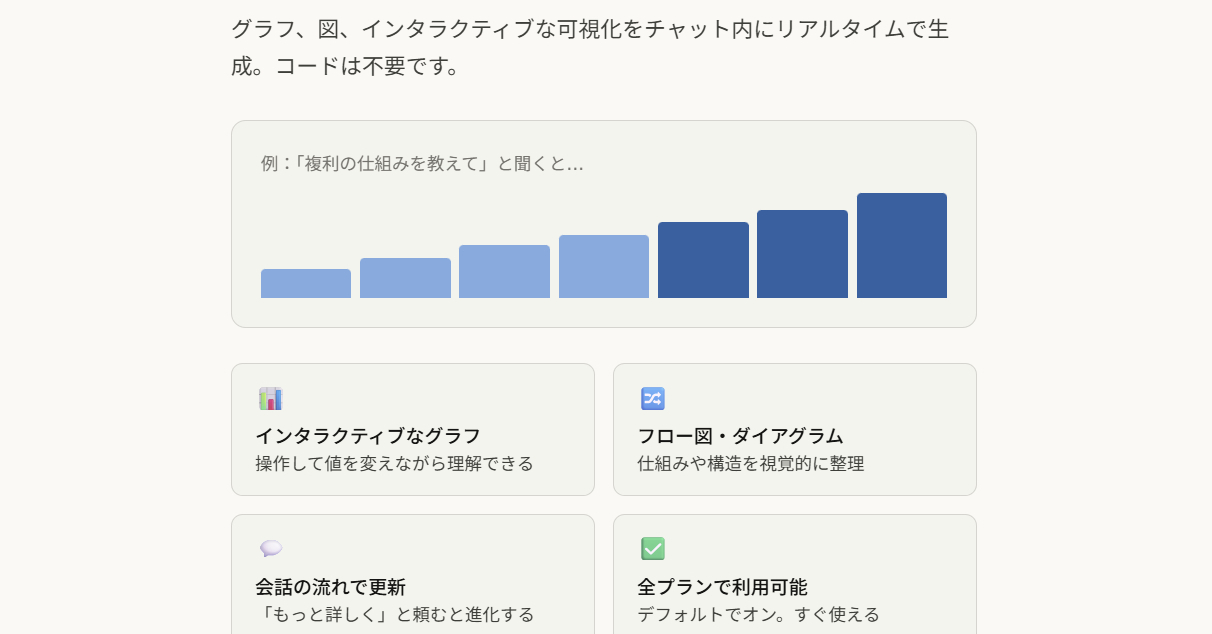
Inline tables, charts, images generated in Claude chat responses
Why It Matters
Enhances Claude's multimodal capabilities, making data presentation seamless for users. Free access democratizes advanced visuals, potentially increasing adoption among developers and analysts.
What To Do Next
Prompt Claude with sample data like 'Plot Q3 sales trends' to test inline charts.
🧠 Deep Insight
Web-grounded analysis with 4 cited sources.
🔑 Enhanced Key Takeaways
- •Claude's visualization feature is built directly into the model's reasoning process, enabling the AI to evaluate whether a prompt benefits from visual representation and generate appropriate graphics contextually, rather than relying on post-hoc image generation[1].
- •The feature represents Anthropic's competitive response to OpenAI's ChatGPT visualization capabilities and Google's multimodal Gemini, positioning Claude as an enterprise-focused presentation assistant for business analysts and educators[1].
- •Visualizations are temporary and inline within conversations—appearing directly in chat rather than side panels—and dynamically evolve as conversations progress, allowing users to request iterative refinements[3].
- •Unlike static image-based diagrams, Claude's visualizations remain fully text-readable and searchable, enabling them to be exposed as part of knowledge bases for future LLM reference[4].
📊 Competitor Analysis▸ Show
| Feature | Claude (Anthropic) | ChatGPT (OpenAI) | Gemini (Google) |
|---|---|---|---|
| Inline Visualization | Yes, auto-detected or user-requested | Interactive visualizations for math/science (launched March 2026) | Multimodal capabilities available |
| Availability | All plans including free tier, beta | Varies by plan | Varies by plan |
| Visual Types | Charts, diagrams, interactive tables | Interactive visualizations | Multimodal outputs |
| Placement | Inline in chat, temporary | Side panels/separate interface | Integrated in responses |
| Reasoning Integration | Built into model reasoning process | Post-hoc generation | Multimodal model architecture |
🛠️ Technical Deep Dive
- Claude's visualization capability is integrated directly into the model's reasoning process, allowing the AI to evaluate prompt context and determine when visual aids enhance understanding[1]
- Visualizations are generated using Claude's understanding of subject matter rather than external charting libraries, enabling contextual appropriateness[1]
- The feature expands on the "Imagine with Claude" temporary experience (September 2025), which enabled interactive visual creation without code exposure[3]
- Visualizations are dynamic and text-based (not image-based), maintaining full searchability and text-readability for downstream LLM reference[4]
- Users can request iterative refinements through natural language prompts (e.g., "visualize how this might change over time")[3]
🔮 Future ImplicationsAI analysis grounded in cited sources
⏳ Timeline
📎 Sources (4)
Factual claims are grounded in the sources below. Forward-looking analysis is AI-generated interpretation.
Weekly AI Recap
Read this week's curated digest of top AI events →
👉Related Updates
AI-curated news aggregator. All content rights belong to original publishers.
Original source: ITmedia AI+ (日本) ↗