代理可觀測性驅動代理評估
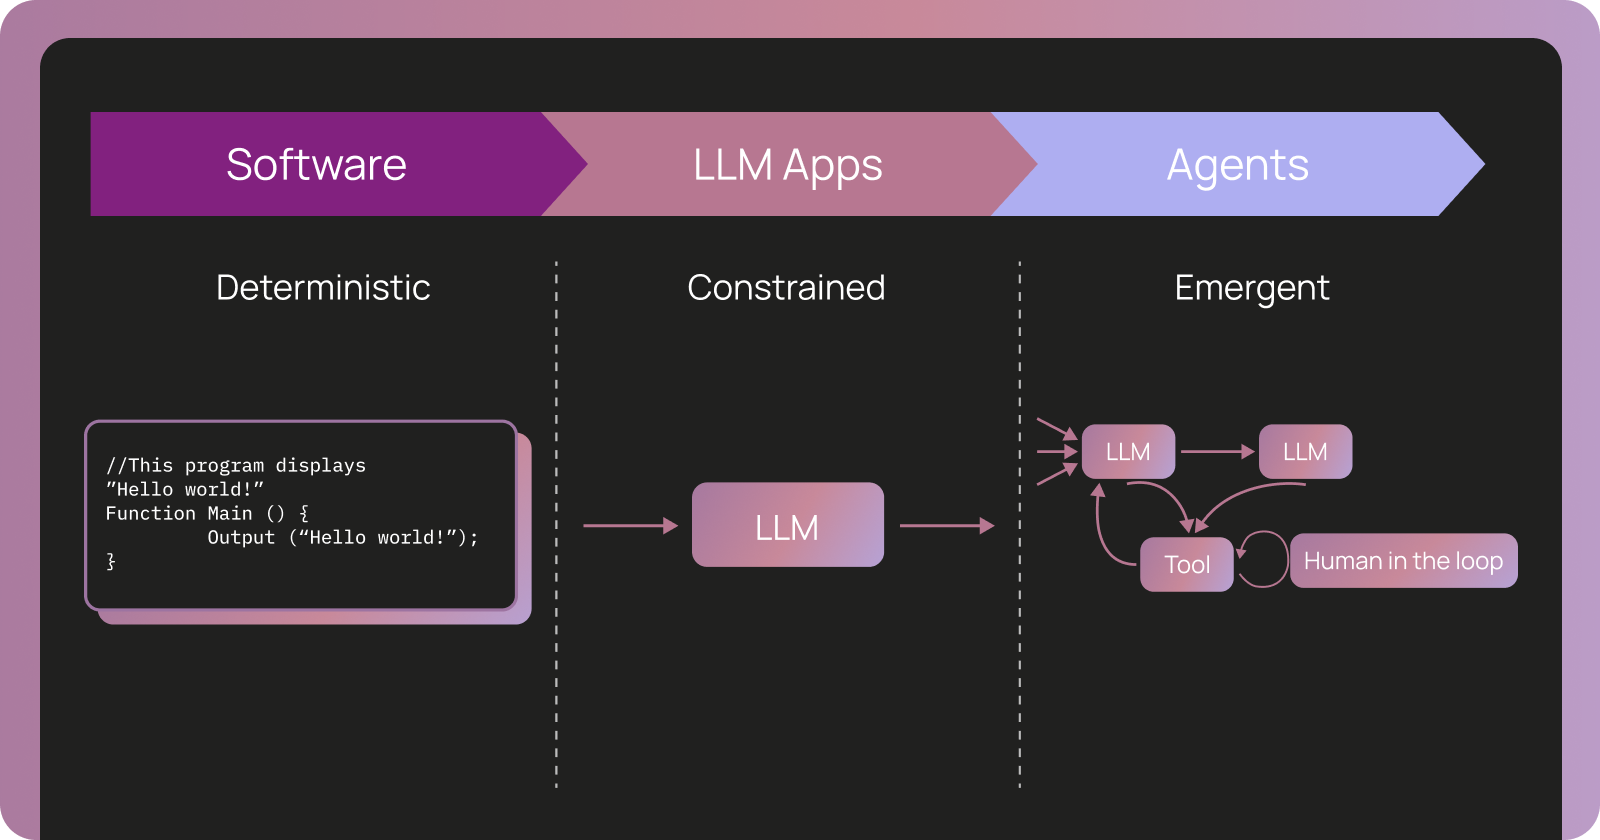
💡Unlock reliable agents: master observability for reasoning insights and eval.
⚡ 30-Second TL;DR
有什麼變化
可觀測性揭示代理內部推理方式
為什麼重要
讓從業人員有效除錯並迭代代理。驅動更好代理效能指標,加速真實世界應用採用。
下一步行動
Use LangChain's observability tools to evaluate your agent's reasoning traces before deployment.
關鍵要點
- •可觀測性揭示代理內部推理方式
- •系統性評估為改進驗證所必需
- •對開發可靠生產級代理至關重要
🧠 深度解析
背景與延伸:來自公開資料,非原文內容。引用 8 個來源。
🔑 增強重點摘要
- •Agent behavior only emerges at runtime and is exclusively captured through observability traces, making production traces the foundation of evaluation strategy rather than separate testing artifacts[1][3]
- •Evaluation granularity maps directly to observability primitives: single-step evaluation for individual runs, full-turn evaluation for complete traces, and multi-turn evaluation for maintaining context across conversations[1]
- •Dual-layered evaluation approach combines offline evaluations using curated golden datasets to catch regressions and edge cases, with online evaluations running on real production traces in real-time to capture unpredictability[6]
- •Production traces power continuous validation through trajectory checks, efficiency monitoring, quality scoring via LLM-as-judge, and failure alerts that surface issues before user reports[1]
- •Leading observability platforms like LangSmith, W&B Weave, and Langfuse use OpenTelemetry standards with custom instrumentation to capture full reasoning traces including prompts, tool selection logic, and execution paths[2][4]
📊 競品分析▸ Show
| Platform | Primary Use Case | Key Features | Pricing Model | Best For |
|---|---|---|---|---|
| LangSmith | LangChain-centric agent debugging | Step-by-step inspection, run replay, side-by-side comparison, Insights Agent (GA Oct 2025) | $39/month per seat | LangChain/LangGraph teams with annotation queues |
| W&B Weave | Multi-framework observability | MCP auto-logging, guardrails, real-time behavior controls | Under CoreWeave (post-2025 acquisition) | Deep agent trace observability across frameworks |
| Langfuse | Multi-step pipeline monitoring | Real-time execution tracking, cost analysis, performance insights | Not specified | General LLM application performance monitoring |
| Truesight | Expert-grounded output evaluation | Domain-specific quality assessment | Not specified | Teams where domain experts define quality standards |
| Arize Phoenix | OTel-native self-hosting | OpenTelemetry-native architecture | Self-hosted option | Organizations requiring on-premise deployment |
| Comet Opik | Automated optimization | Automated improvement workflows | Not specified | Teams seeking continuous optimization |
| Braintrust | CI/CD integration | Pipeline integration, automated logging | Not specified | Teams with existing CI/CD workflows |
🛠️ 技術深入
• Observability Primitives Architecture: Traces, runs, and threads form the foundational data structures; traces capture complete execution paths including prompts, tool calls, and state changes; runs represent individual agent steps; threads maintain multi-turn conversation context[1] • Instrumentation Standards: OpenTelemetry (OTel) standard enables metadata sharing across frameworks; custom instrumentation layers provide framework-specific flexibility beyond standard telemetry[2] • Evaluation Metrics Layers: Three-layer evaluation framework operates on final output metrics, individual agent component assessment, and underlying LLM performance measurement[7] • Trajectory Analysis: LLM-as-judge methodology evaluates not just outputs but decision paths, tool-calling patterns, and guardrail compliance; trajectory checks flag unusual patterns and verify safety/policy guardrail ordering[1][6] • Production Trace Integration: Automatic CI/CD logging converts test suites into datasets; traces become queryable datasets enabling drill-down analysis to identify where agents diverge from ground truth[6] • Performance Benchmarking: Baseline establishment measures application performance without instrumentation; platform integration tests measure overhead introduction across five leading observability tools[2]
🔮 前景展望AI analysis grounded in cited sources
The convergence of observability and evaluation represents a fundamental paradigm shift in AI systems development. Unlike traditional software where testing and tracing are separate concerns, agentic systems require unified workflows where production traces directly inform evaluation strategies. This creates several industry implications: (1) Observability becomes a first-class requirement rather than optional monitoring, driving adoption of platforms like LangSmith and W&B Weave across enterprise teams; (2) The dual-layered evaluation approach (offline safety nets plus online production monitoring) establishes new quality standards for production-grade agents, particularly in regulated domains; (3) Real-time failure detection and trajectory analysis enable proactive issue resolution before user impact, reducing operational risk; (4) The standardization around OpenTelemetry and custom instrumentation creates ecosystem consolidation opportunities; (5) Human-in-the-loop mechanisms and annotation queues at scale suggest emerging roles for specialized evaluation engineering teams; (6) Domain-specific evaluation tools (like Truesight for expert-grounded assessment) indicate market segmentation by vertical requirements rather than generic solutions.
⏳ 時間線
📎 來源 (8)
Factual claims are grounded in the sources below. Forward-looking analysis is AI-generated interpretation.
- langchain.com — Agent Observability Powers Agent Evaluation
- aimultiple.com — Agentic Monitoring
- blog.langchain.com — January 2026 Langchain Newsletter
- goodeyelabs.com — Top AI Agent Evaluation Tools 2026
- youtube.com — Watch
- blog.langchain.com — Customers Monday
- aws.amazon.com — Evaluating AI Agents Real World Lessons From Building Agentic Systems at Amazon
- braintrust.dev — Best AI Evaluation Tools 2026
AI 週報
閱讀本週精選 AI 大事摘要 →
👉相關動態
AI 策展新聞聚合。所有內容版權歸原始發布者所有。
原始來源: LangChain Blog ↗
每週 AI 簡報
每週一封,可隨時退訂。