🇬🇧The Register - AI/ML•較早收集於 24m
Claude 推出互動圖表
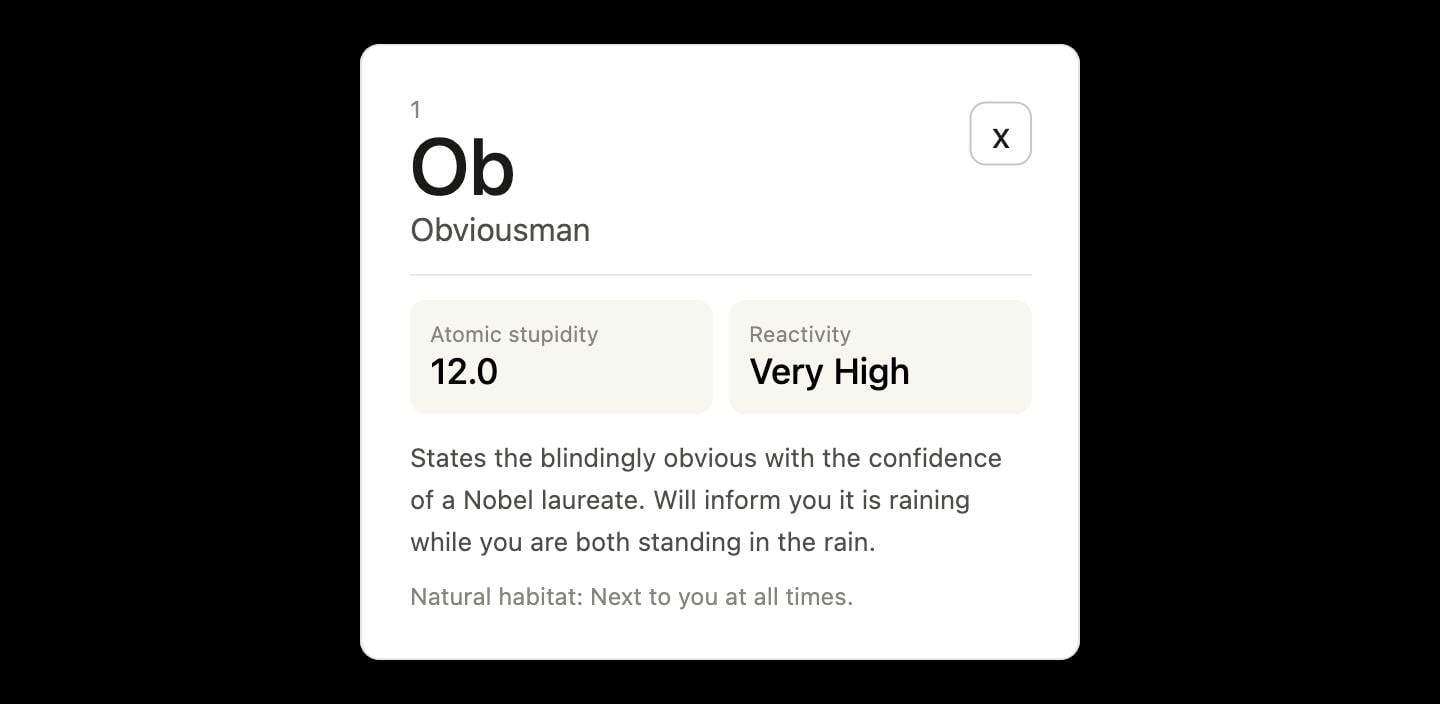
#charts#visualization#interactive-appsclaudeclaudeanthropic
💡Claude 圖表實現視覺化 AI 對話—適合資料工作流程(24字)
⚡ 30-Second TL;DR
有什麼變化
Claude 對話現支援互動應用如圖表
為什麼重要
提升 Claude 在數據密集任務的實用性,協助開發者在分析與呈現。可能透過更直觀、可信輸出增加採用率。
下一步行動
提示 Claude 為您的資料分析查詢建立互動圖表。
誰應關注:Developers & AI Engineers
關鍵要點
- •Claude 對話現支援互動應用如圖表
- •視覺元素伴隨 AI 回應以利驗證
- •數據視覺化勝過純文字 token
🧠 深度解析
背景與延伸:來自公開資料,非原文內容。引用 4 個來源。
🔑 增強重點摘要
🔮 前景展望AI analysis grounded in cited sources
⏳ 時間線
2025-09
預覽「Imagine with Claude」功能
2026-03
推出 Claude 內嵌互動圖表與視覺化 beta 版
📎 來源 (4)
Factual claims are grounded in the sources below. Forward-looking analysis is AI-generated interpretation.
- gadgets360.com — Anthropic Claude AI Inline Interactive Charts Diagrams Visualisations in Responses Released 11209802
- moneycontrol.com — Anthropic Adds Real Time Charts and Graphs to Claude Responses Article 13858765
- app.daily.dev — Anthropic S Claude Can Now Draw Interactive Charts and Diagrams Nnlu6gjkx
- the-decoder.com — Claude Can Now Create Interactive Charts and Visualizations Directly in Chat
📰
AI 週報
閱讀本週精選 AI 大事摘要 →
👉相關動態
AI 策展新聞聚合。所有內容版權歸原始發布者所有。
原始來源: The Register - AI/ML ↗
每週 AI 簡報
每週一封,可隨時退訂。